Scriptly Helps Pharmacies Identify Trends in Real Time with Reveal
Stay updated with the latest press releases, press coverage, product news, and interviews from around the web, including insights on the benefits of embedded analytics.
We live in an era where data shapes decisions across industries. While data visualizations have become essential, not all standard visualizations cater to specialized reporting needs.
Enter DIY Custom Visualizations, a transformative feature we’re thrilled to introduce on our platform. Dive in to discover its unmatched benefits and how you can craft unique reports effortlessly.
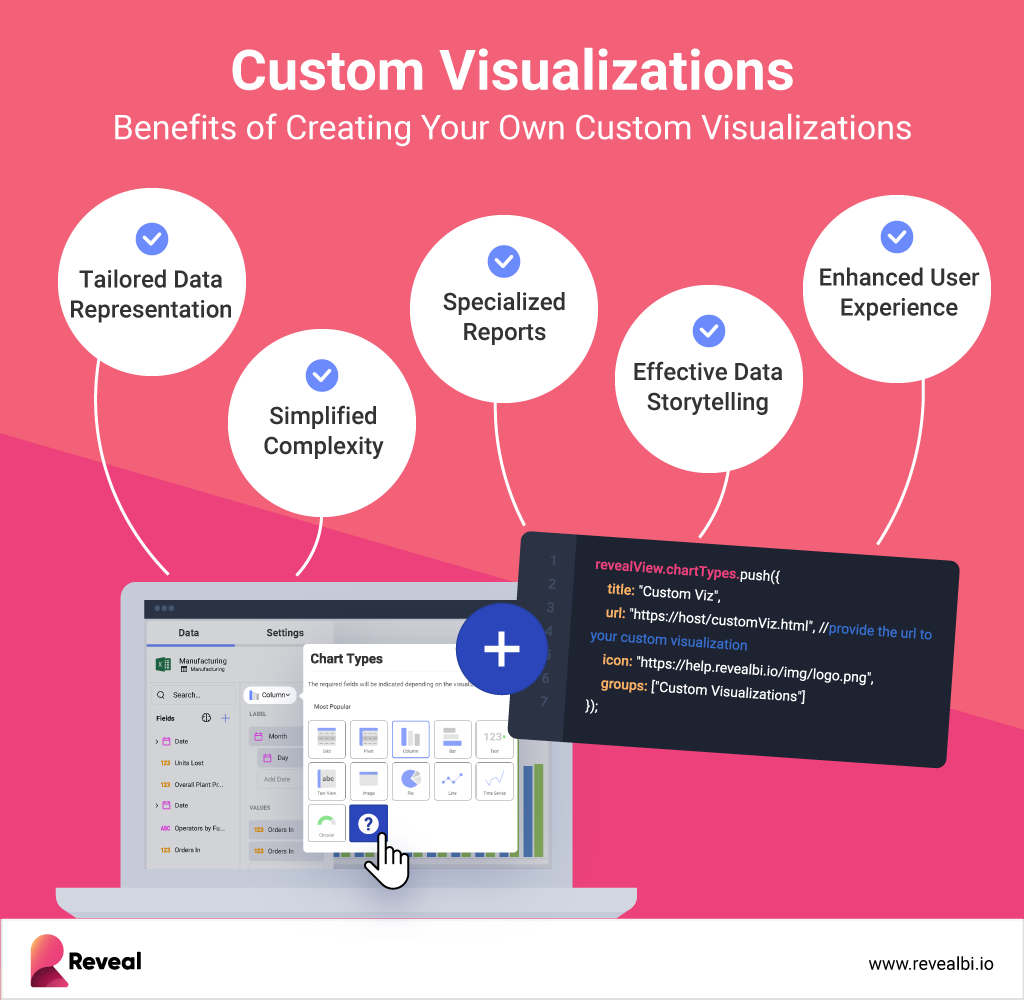
Before we dive into the how, let’s explore the top benefits of creating your own custom visualizations:
Custom visualizations allow you to portray intricate data in an easily digestible format, ensuring alignment with your audience’s requirements. Whether you’re dealing with customer demographics, supply chain logistical management, financial data, or presenting to executives, clients, or colleagues, you can adapt the visualization to align with their needs.
Complex datasets often contain a wealth of key business insights but are typically overwhelming when presented in a raw format. Custom visualizations simplify their complexity by distilling data into clear, intuitive visuals highlighting essential trends, patterns, and outliers.
In healthcare, finance, and manufacturing industries, specialized reports are often required to meet regulatory standards or specific business needs. With Reveal’s customization capabilities, you can create reports that adhere to these requirements without compromising data accuracy or clarity.
Visualizations are about telling a story with your data; custom visualizations enable you to craft highly effective data-driven stories. By arranging data elements and visuals in a narrative, you can guide your audience through a logical flow of information, leading decision-makers toward actionable insights.
A well-designed custom visualization allows users to interact with the data more effectively, gaining deeper insights and a better understanding of the underlying information.

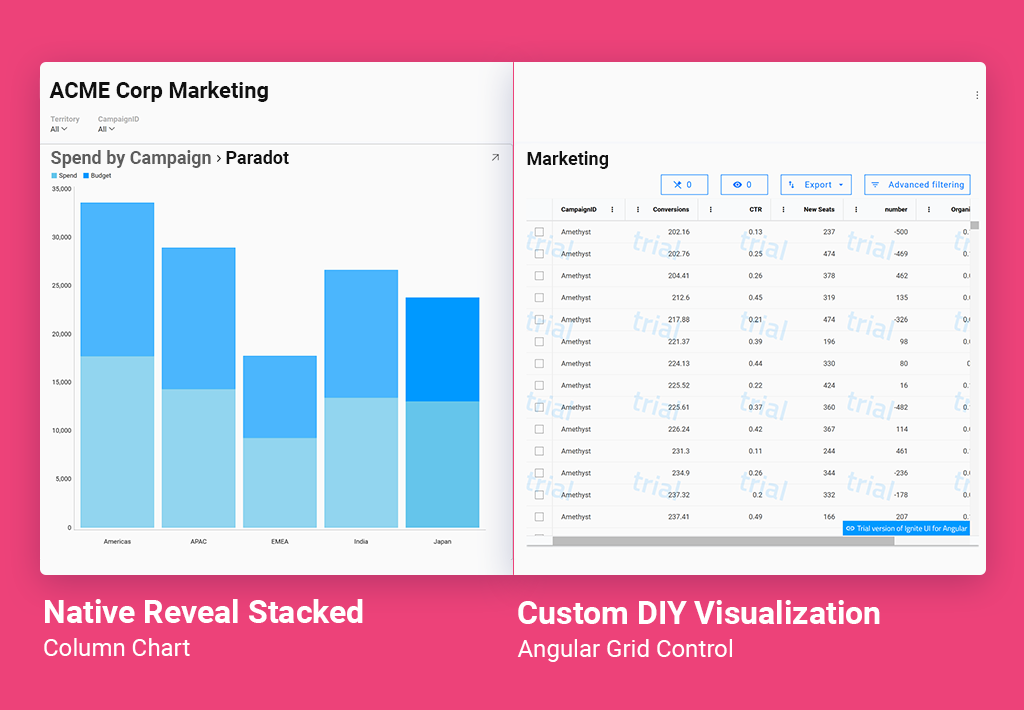
In Reveal, our extensive array of visualizations offers a versatile range of core visualization capabilities. These encompass data comparison, part-to-whole analysis, data distribution, trending analysis, data relationships, KPIs, gauges, and geospatial data visualization. You’ll find common business chart types as well as specialized options such as treemaps and scatter map charts among our offerings.
But that’s not all. With our innovative addition to the platform, you can now take control of the chart types available within your dashboards. Tailor the experience for your users by eliminating any default chart types that may not suit your specific needs. Create customized groups to efficiently organize the available chart types, ensuring an intuitive and user-friendly interface.
Moreover, we empower you to instantly integrate your own custom visualizations, complete with unique names and icons, with just four lines of code. This feature unlocks a universe of possibilities for showcasing your data in fresh and exciting ways, catering to your specific requirements.
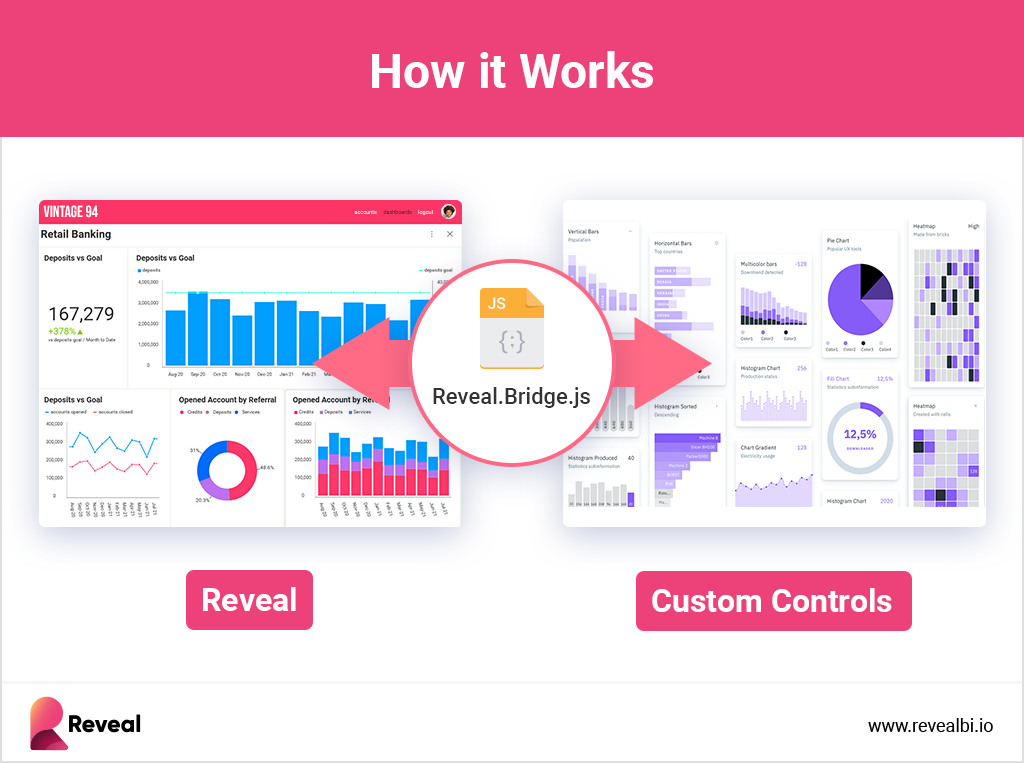
Next, let’s explore the process of how custom data visualizations work in Reveal, step by step, from adding the Reveal bridge JavaScript file to applying your branding and theming.


With Reveal’s DIY custom visualizations feature, you can tailor the experience for your users by controlling the chart types available within your dashboards. This customization ensures that your data is presented in a way that’s most relevant to your specific needs. Here’s how to do it in just a few lines of code:
var barConfig = revealView.chartTypes.find(x => x.chartType == 'BarChart');
barConfig.title = 'My Cool Bar';
barConfig.icon = 'https://help.revealbi.io/img/logo.png';
barConfig.groups = ["Enterprise Visualizations", "HR", "Some Other Category"]; To update an existing chart type, you can easily modify its properties, including its name, icon, and grouping. Find the chart type in the revealView.chartTypes property and add these four lines of code:
var barConfig = revealView.chartTypes.find(x => x.chartType == ‘BarChart’);
barConfig.title = ‘My Cool Bar’;
barConfig.icon = ‘https://help.revealbi.io/img/logo.png’;
barConfig.groups = [“Enterprise Visualizations”, “HR”, “Some Other Category”];
If there are default chart types that you don’t need, you can remove them effortlessly by finding the index of the chart type item you want removed, and remove it from the chartTypes array with this code:
var gridConfig = revealView.chartTypes.find(x => x.chartType == ‘Grid’);
revealView.chartTypes.splice(revealView.chartTypes.indexOf(gridConfig), 1);
Adding your custom visualizations as new chart types in the Chart Types drop-down is the most exciting part. This opens up a world of possibilities for presenting your data, and it only takes these few lines of code:
revealView.chartTypes.push({
title: “Custom Viz”,
url: “https://host/customViz.html”, //provide the url to your custom visualization
icon: “https://help.revealbi.io/img/logo.png”,
groups: [“Custom Visualizations”]
});
See for yourself how easily it is to create your own unique visualizations in our tutorial by Reveal’s Sr. VP of Developers Tools and data analytics expert, Jason Beres:
We hope you enjoyed learning about custom visualizations with us. You can learn more about our product by scheduling a free product tour so we can take you through Reveal’s different features and functionalities. Alternatively, you can also download our SDK and try it yourself.
If you’re testing the feature in our product but are facing any issues or need extra guidance, contact our product team via our Discord channel.
Finally, we would love you to share your thoughts with us. Your input shapes our product, ensuring we deliver features that provide maximum value to you and your customers. Let us know if you think there is anything else we can add to improve Reveal’s ease of use, and we will add it to our roadmap.

The promise and perils of Artificial Intelligence (AI) has been dominating the headlines with everyone from software developers to students working on ways to integrate it into their daily processes. This burgeoning interest in AI is borne out by the fifth annual Reveal 2024 Top Software Development Challenges survey, which found that the biggest software development challenge in 2024 will be incorporating AI into the development process (40.7%).

According to a Reveal survey, 26.2% of developers struggle to manage their workload, while 26% of them consider client’s expectations to be too high. Still, the software engineering landscape is being improved and reshaped dramatically thanks to AI technologies, especially large language models (LLMs). Rather than wasting time on the manual process, AI tools help […]

Along with the rise in AI comes a wave of details that must be addressed in order to properly implement solutions. While there’s no formula to estimate the ratio of sexiness to necessity, it’s safe to assume many business leaders spend more time thinking about the possibilities of AI than they do the nuts and […]

As artificial intelligence gets more ubiquitous, integration vexes the C-Suite. One big reason why CFOs aren’t seeing the payoffs they expected is an operational problem – the AI integration process has stalled many new AI implementations. That’s the takeaway from a new study.

The year 2024 is shaping up to be a challenging one for software development. The annual Reveal 2024 survey report by Infragistics has revealed the top software development challenges that professionals in the industry will face this year. The report provides valuable insights into the trends and issues that are shaping the software development landscape in 2024.

The biggest software development challenge in 2024 will be incorporating AI into the development process, according to a new report. The Reveal survey of 585 software developers and IT professionals from Infragistics shows 40.7 percent name this as the top challenge followed by high workload (29.6 percent) and increased customer demands (29.2 percent).

The promise and perils of Artificial Intelligence (AI) has been dominating the headlines with everyone from software developers to students working on ways to integrate it into their daily processes. This burgeoning interest in AI is borne out by the fifth annual Reveal 2024 Top Software Development Challenges survey from Infragistics, which found that the […]

AI is expected to have widespread integration this year as it becomes a ubiquitous presence among consumers, businesses, and global markets. Nearly half of the Reveal survey respondents (49.2%) plan to implement AI tools in 2024 compared to 27% in 2023.

The spotlight on both the promises and risks of Artificial Intelligence (AI) has been prevalent in recent headlines, capturing the attention of a wide range of individuals, from software developers to students, who are exploring methods to seamlessly integrate it into their routines. This growing interest in AI is underscored by the results of the […]
For media inquiries, press releases, or interview requests, please contact us.
We live in an era where data shapes decisions across industries. While data visualizations have become essential, not all standard visualizations cater to specialized reporting needs.
Enter DIY Custom Visualizations, a transformative feature we’re thrilled to introduce on our platform. Dive in to discover its unmatched benefits and how you can craft unique reports effortlessly.
Before we dive into the how, let’s explore the top benefits of creating your own custom visualizations:
Custom visualizations allow you to portray intricate data in an easily digestible format, ensuring alignment with your audience’s requirements. Whether you’re dealing with customer demographics, supply chain logistical management, financial data, or presenting to executives, clients, or colleagues, you can adapt the visualization to align with their needs.
Complex datasets often contain a wealth of key business insights but are typically overwhelming when presented in a raw format. Custom visualizations simplify their complexity by distilling data into clear, intuitive visuals highlighting essential trends, patterns, and outliers.
In healthcare, finance, and manufacturing industries, specialized reports are often required to meet regulatory standards or specific business needs. With Reveal’s customization capabilities, you can create reports that adhere to these requirements without compromising data accuracy or clarity.
Visualizations are about telling a story with your data; custom visualizations enable you to craft highly effective data-driven stories. By arranging data elements and visuals in a narrative, you can guide your audience through a logical flow of information, leading decision-makers toward actionable insights.
A well-designed custom visualization allows users to interact with the data more effectively, gaining deeper insights and a better understanding of the underlying information.

In Reveal, our extensive array of visualizations offers a versatile range of core visualization capabilities. These encompass data comparison, part-to-whole analysis, data distribution, trending analysis, data relationships, KPIs, gauges, and geospatial data visualization. You’ll find common business chart types as well as specialized options such as treemaps and scatter map charts among our offerings.
But that’s not all. With our innovative addition to the platform, you can now take control of the chart types available within your dashboards. Tailor the experience for your users by eliminating any default chart types that may not suit your specific needs. Create customized groups to efficiently organize the available chart types, ensuring an intuitive and user-friendly interface.
Moreover, we empower you to instantly integrate your own custom visualizations, complete with unique names and icons, with just four lines of code. This feature unlocks a universe of possibilities for showcasing your data in fresh and exciting ways, catering to your specific requirements.
Next, let’s explore the process of how custom data visualizations work in Reveal, step by step, from adding the Reveal bridge JavaScript file to applying your branding and theming.


With Reveal’s DIY custom visualizations feature, you can tailor the experience for your users by controlling the chart types available within your dashboards. This customization ensures that your data is presented in a way that’s most relevant to your specific needs. Here’s how to do it in just a few lines of code:
var barConfig = revealView.chartTypes.find(x => x.chartType == 'BarChart');
barConfig.title = 'My Cool Bar';
barConfig.icon = 'https://help.revealbi.io/img/logo.png';
barConfig.groups = ["Enterprise Visualizations", "HR", "Some Other Category"];
To update an existing chart type, you can easily modify its properties, including its name, icon, and grouping. Find the chart type in the revealView.chartTypes property and add these four lines of code:
var barConfig = revealView.chartTypes.find(x => x.chartType == ‘BarChart’);
barConfig.title = ‘My Cool Bar’;
barConfig.icon = ‘https://help.revealbi.io/img/logo.png’;
barConfig.groups = [“Enterprise Visualizations”, “HR”, “Some Other Category”];
If there are default chart types that you don’t need, you can remove them effortlessly by finding the index of the chart type item you want removed, and remove it from the chartTypes array with this code:
var gridConfig = revealView.chartTypes.find(x => x.chartType == ‘Grid’);
revealView.chartTypes.splice(revealView.chartTypes.indexOf(gridConfig), 1);
Adding your custom visualizations as new chart types in the Chart Types drop-down is the most exciting part. This opens up a world of possibilities for presenting your data, and it only takes these few lines of code:
revealView.chartTypes.push({
title: “Custom Viz”,
url: “https://host/customViz.html”, //provide the url to your custom visualization
icon: “https://help.revealbi.io/img/logo.png”,
groups: [“Custom Visualizations”]
});
See for yourself how easily it is to create your own unique visualizations in our tutorial by Reveal’s Sr. VP of Developers Tools and data analytics expert, Jason Beres:
We hope you enjoyed learning about custom visualizations with us. You can learn more about our product by scheduling a free product tour so we can take you through Reveal’s different features and functionalities. Alternatively, you can also download our SDK and try it yourself.
If you’re testing the feature in our product but are facing any issues or need extra guidance, contact our product team via our Discord channel.
Finally, we would love you to share your thoughts with us. Your input shapes our product, ensuring we deliver features that provide maximum value to you and your customers. Let us know if you think there is anything else we can add to improve Reveal’s ease of use, and we will add it to our roadmap.